This Is Garbage! Washington State Highways Are Among the Most Littered in US
There is so much garbage littering Washington state highways, we rank 42% higher than the US average.
It's not that the Department of Ecology is doing a more effective job here compared to other states. We actually average more litter per mile, and it's everything from needles to RV's.
According to the Department of Ecology, the national average totals about 5,700 pieces of litter per mile. In Washington, we have about 8,100 pieces of garbage littering roads and parks. That works out to five pounds of trash per person.
Ecology didn't even include that mess from homeless camps in the totals.

KING5 reports taxpayers are spending some $6 million statewide on litter collection and it's likely not enough.
Washington state agencies are devoting $12 million annually to clean up state highways according to the Washington Traffic Safety Commission.
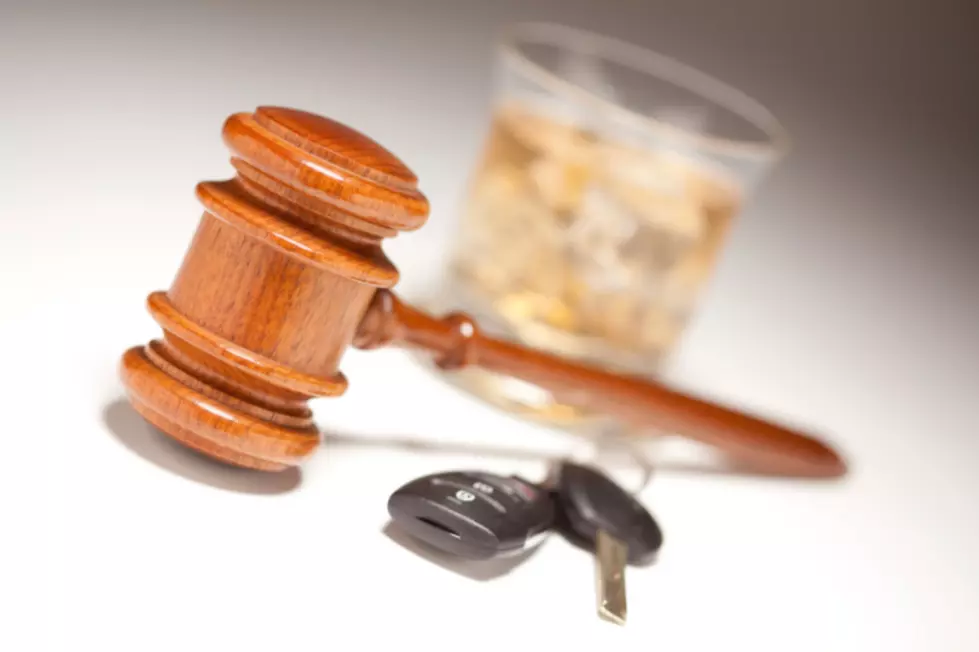
This year, the Washington legislature passed a law making it easier to prosecute illegal dumping and increasing fines up to $1000. The new law takes effect June 6th.
Littering and driving with an unsecured vehicle load are against the law in Washington.
Fines range from $50 to $5,000. If something falls out of your vehicle or injures someone, you could face possible jail time. There are stricter laws in some local jurisdictions.
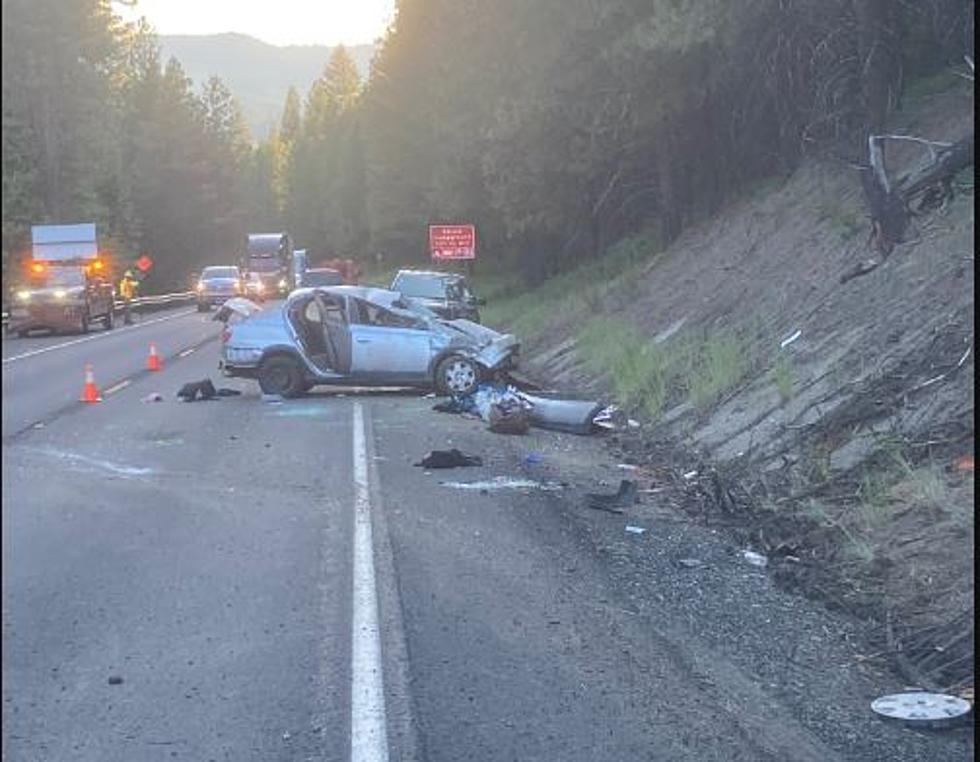
Litter on the highways can turn deadly
Unsecured loads cause about 300 crashes and 30 injuries annually in Washington and contribute about 40% of the roadside litter problem, according to the Traffic Safety Commission.
The National Transportation Safety Administration reports on 2019 statistics that show road debris resulted in
- 739 deaths
- 17, 367 injuries
- 89,915 property damage crashes
These Are Allegedly the Dirtiest Cities and Towns in Oregon and Washington
Gallery Credit: Reesha Cosby
Counties Where the Most Opioids Are Dispensed in Washington
Gallery Credit: Stacker
More From NewsRadio 560 KPQ